
Here are two quick ways any local operator can check to see if your website is showing up when people are ready to buy.
Check the % of Traffic Going to Buying Pages
One of the simplest ways to understand how your website is performing is to look at where your visitors are landing.
You can get a good idea of how many visitors are landing on your “buying pages” compared to your information-led pages using Google Search Console (GSC).
It’ll tell you how many visitors your site gets through organic search every month.
You can filter this data to find out how many of these visitors are landing on informational pages vs checkout or booking pages.
Here’s how:
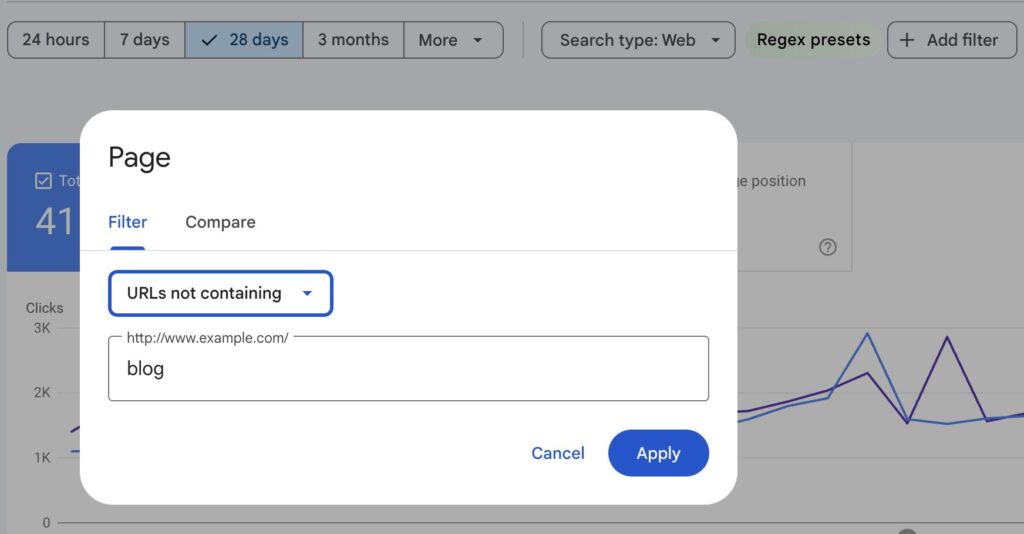
In GSC, click “Add filter” and filter URLs that do not contain “blog.”
This isolates traffic going to the rest of your site – the pages that are more likely tied to purchasing intent.
This works best if your site uses a subfolder structure
(example: /blog/title vs /category/title)
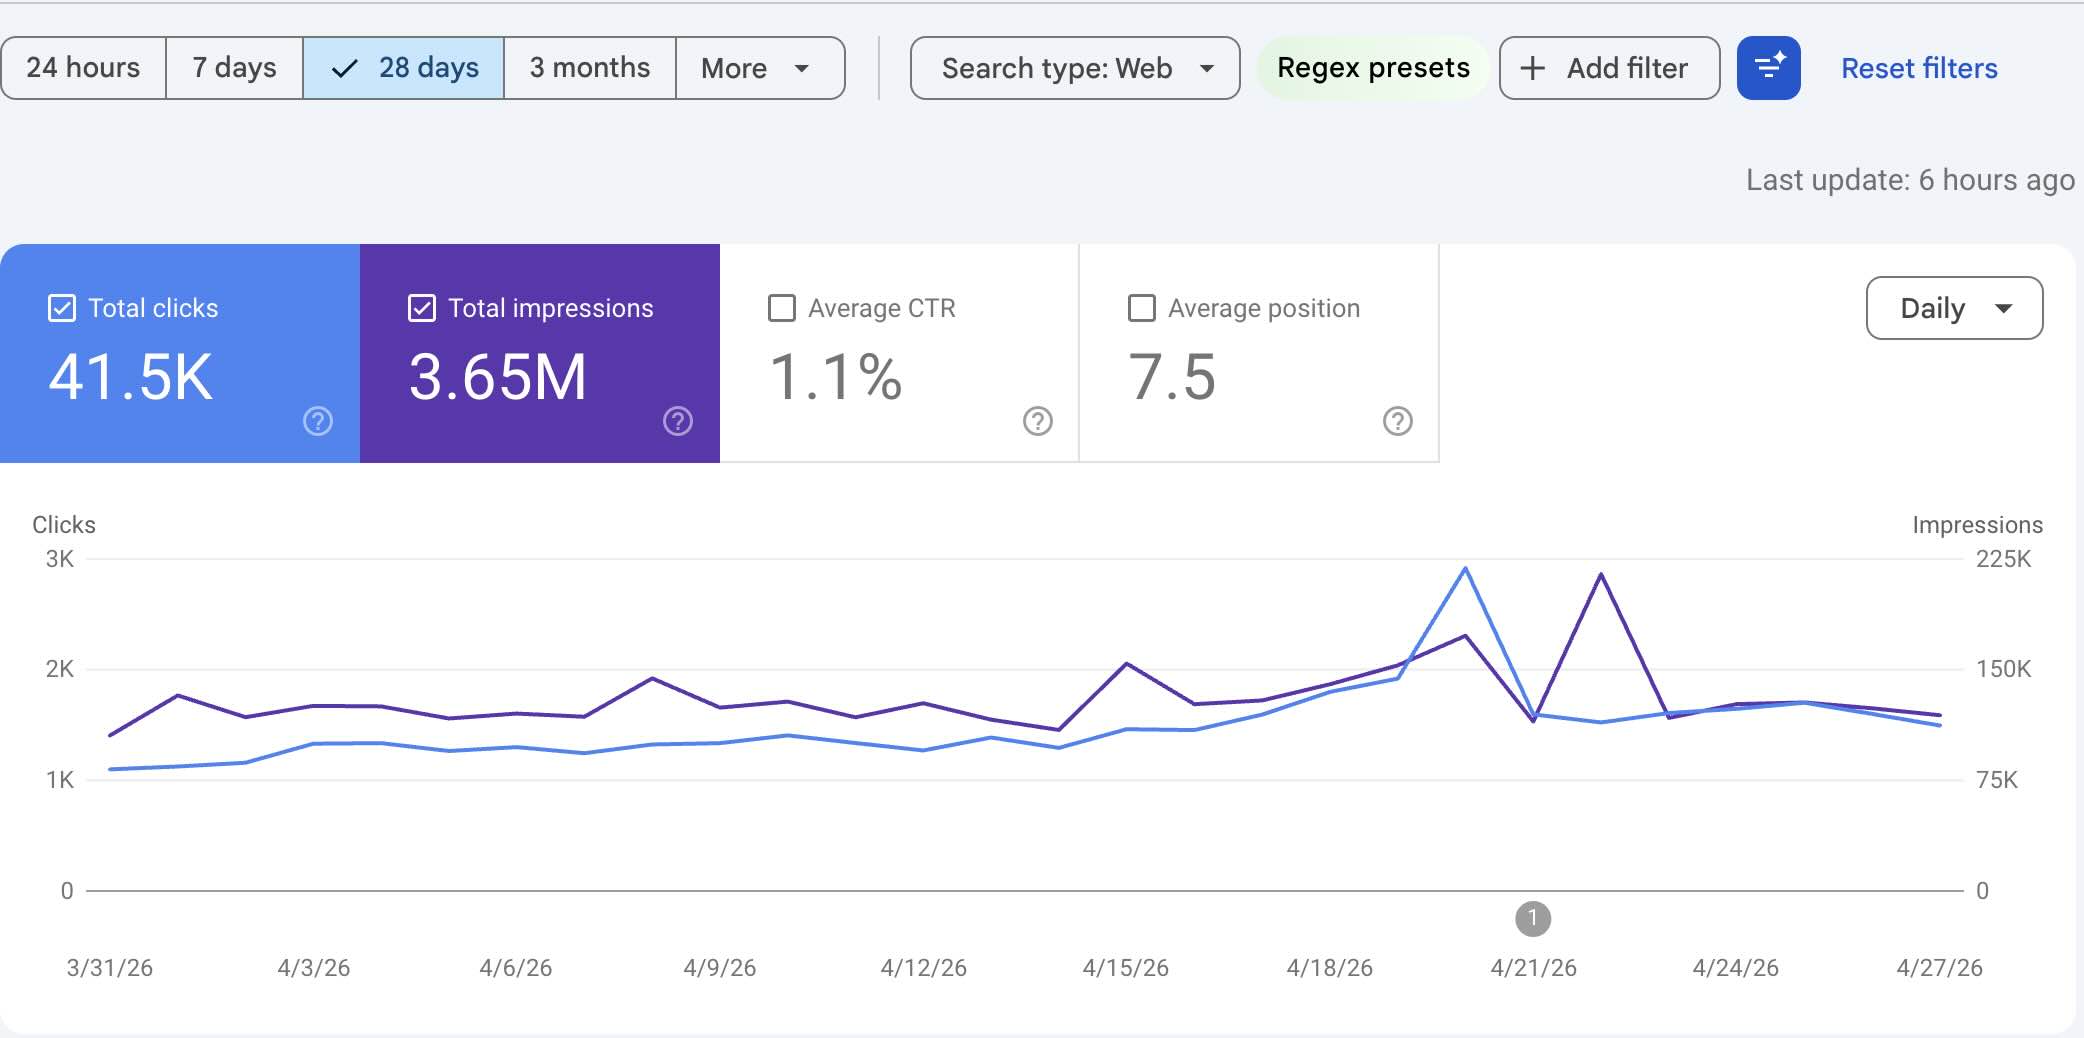
In the example above, the site gets 41.5K monthly “clicks” or visits from organic search.
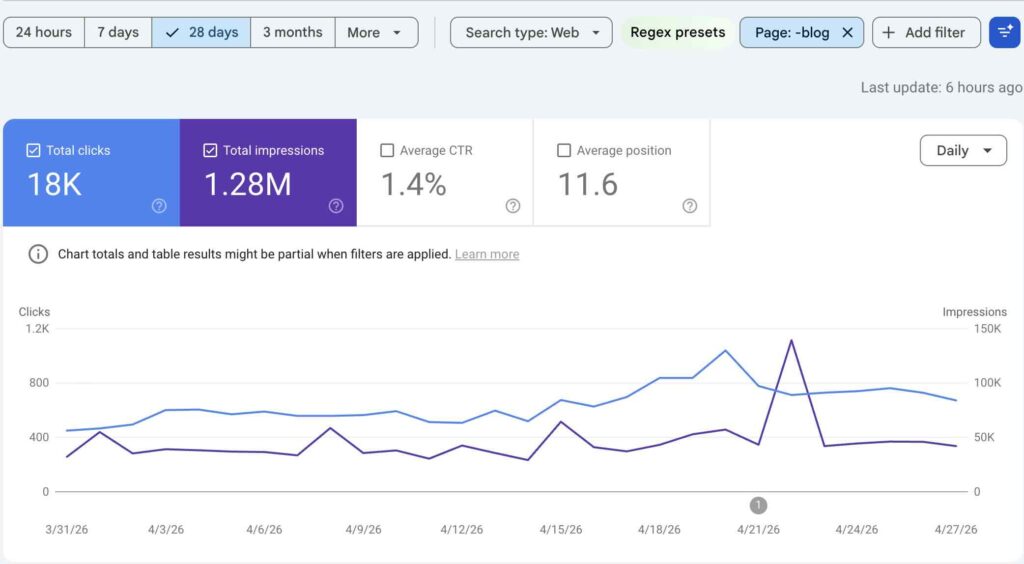
After filtering out URLs containing “blog,” traffic drops to 18K visits.
That means:
18K visitors (43%) are landing on non-blog pages and 23.5K visitors (57%) are landing on blog content.
This is a healthy distribution. It shows the blog is doing its job by bringing new users into the funnel. But the site isn’t dependent on it to generate sales.
Nearly half of all traffic is landing on pages designed to convert customers.
How to See Where Your Marketing Revenue is Coming From
You can take this a step further by looking at how different parts of your site perform in terms of engagement and revenue.
Google Analytics (GA4) will give you a good idea of how your traffic and revenue is progressing over time from your marketing channels.
The rest of the website outside the blog
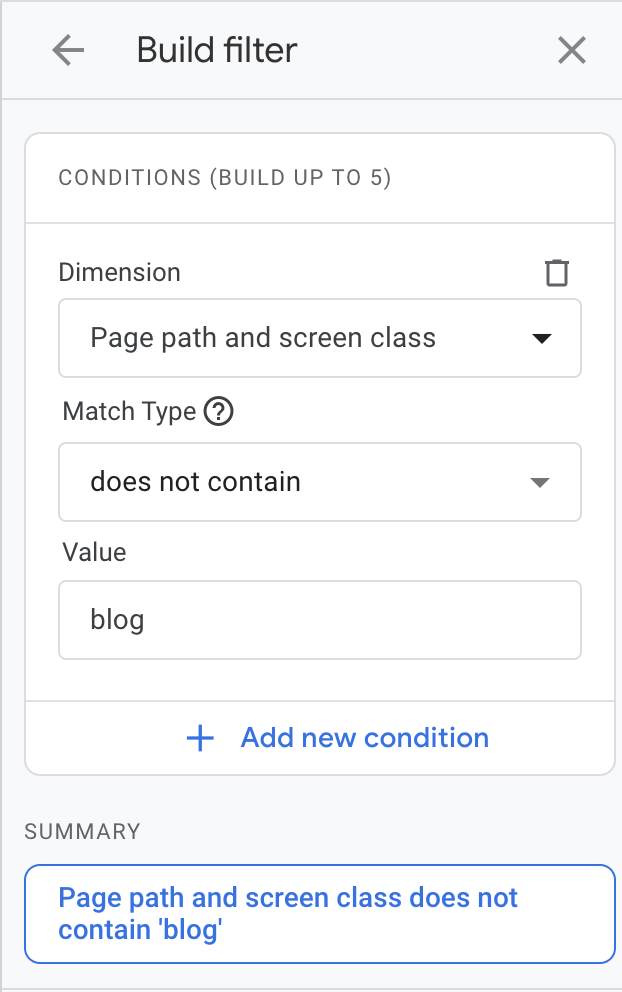
Using a similar filter in GA4 (excluding URLs that contain “blog”), you can isolate how the rest of your site is performing.
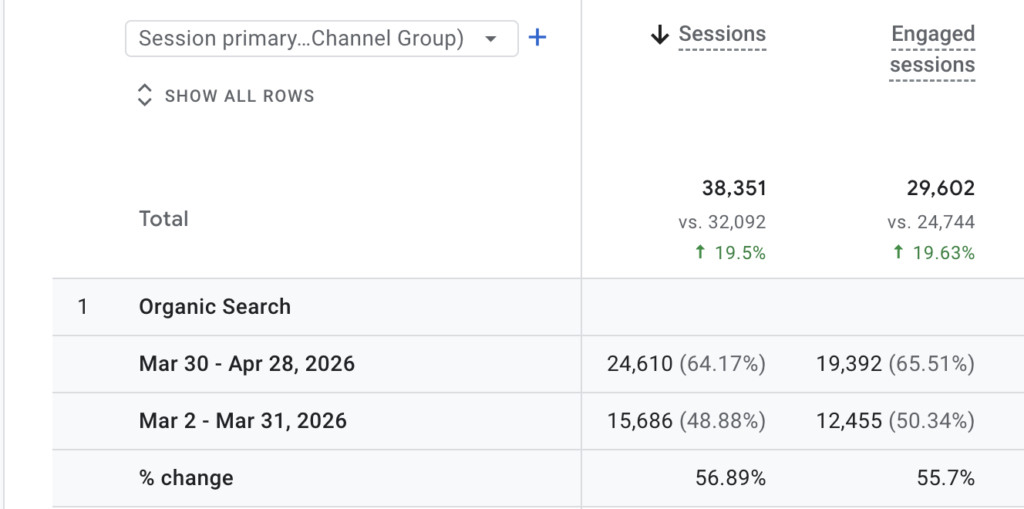
In the example above, when blog URLs are excluded, engaged visitors increased by 55.7% over the last 30 days.
This tells us that the core pages – categories, products, service pages – are actively growing and pulling in more qualified traffic.
The blog by itself
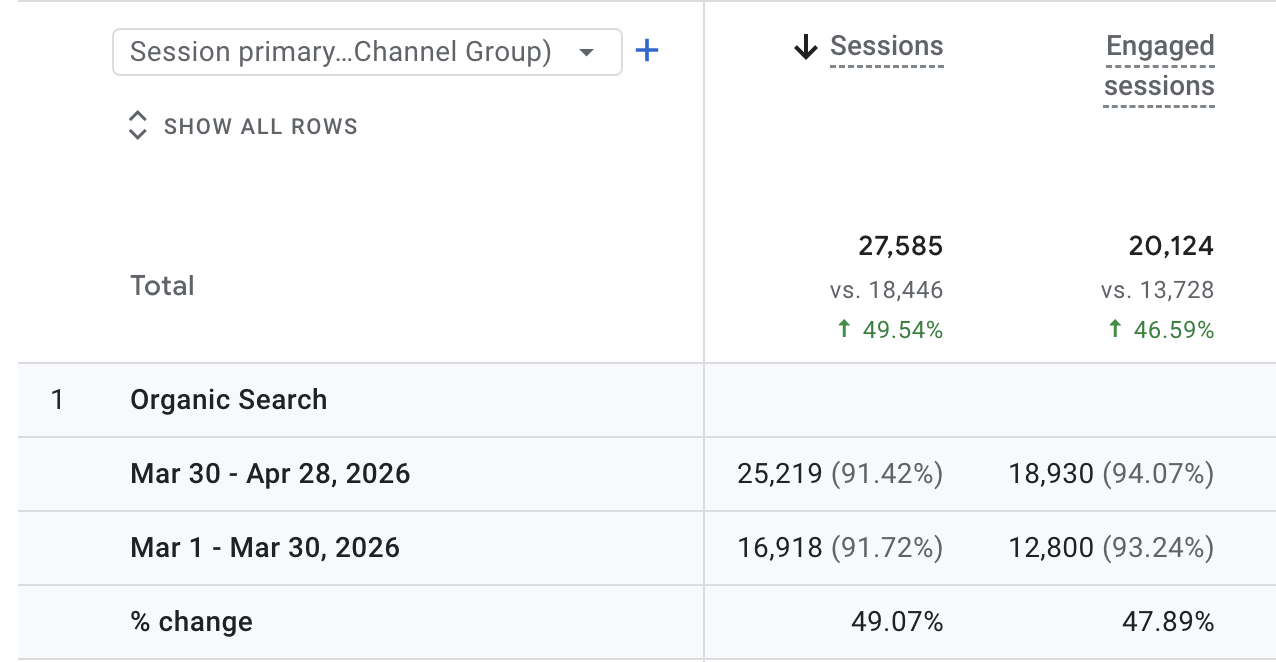
When you filter to only include URLs containing “blog,” engaged visits increased by 48%.
This signals that this website growth isn’t fueled by it’s blog. It’s blog is working together with the rest of it’s website to drive discovery.
It’s bringing in new visitors and capturing early-stage interest. But it’s not the engine driving revenue. The rest of the site is.
Where revenue actually comes from
The data also tells you which pages generate the most revenue for a website.
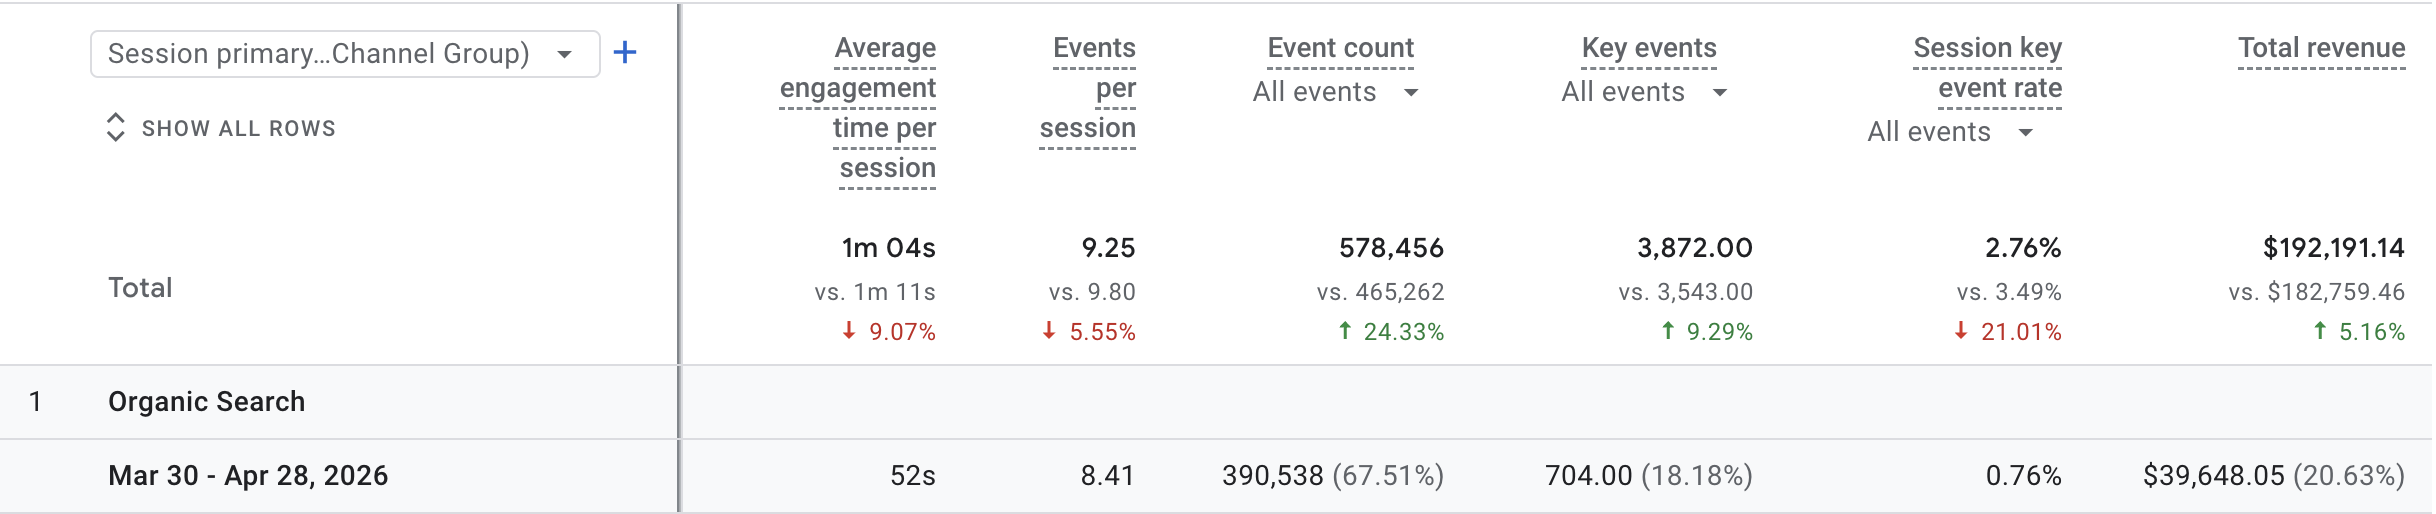
Revenue from the rest of the site
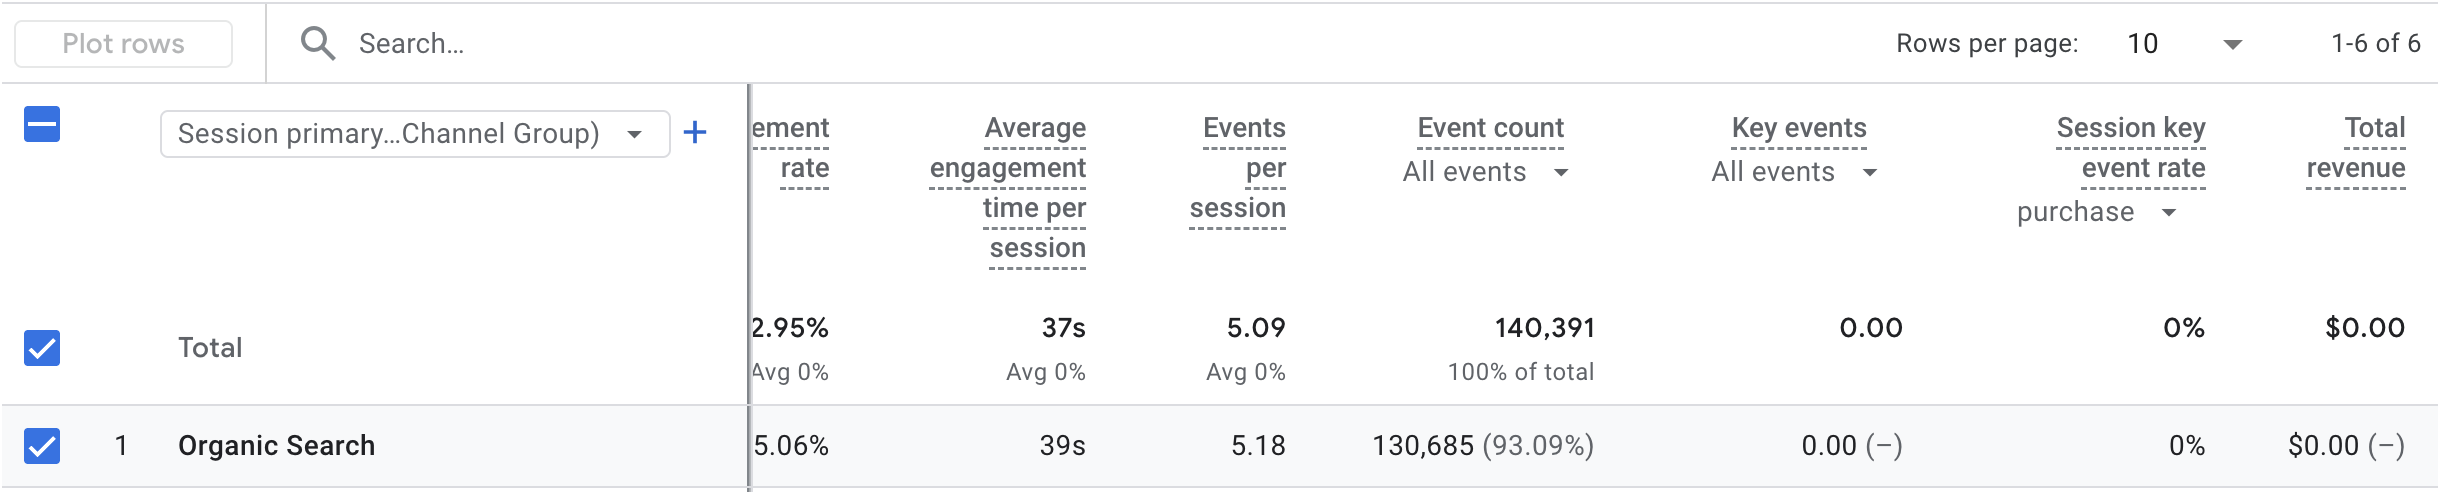
Revenue directly from blog pages
The site generated nearly $40K from organic search. When isolating blog pages revenue drops to $0.
That’s because the blog isn’t designed to sell. It serves many uses for a growing website but based on the data, a marketing strategy meant to increase sales shouldn’t be built around blog content.
As you can see from the example, informational content on your website works best when pair with buyer-driven content. That can play out in the form of created dedicated pages that give clarity to the types of product and services you offer in your area.
How to Use This to Grow Revenue
This is a simple way to quickly gauge the value of the traffic coming to your site.
Most visitors will land either on your blog or on the pages that showcase what you actually offer.
When those non-blog pages are built around what people are actively searching for, that traffic becomes far more valuable because it’s positioned to convert visitors into customers.